 Debugging Rule Chains
This section describes how to debug rule chains in RuleGo-Editor to verify that data flows as expected.
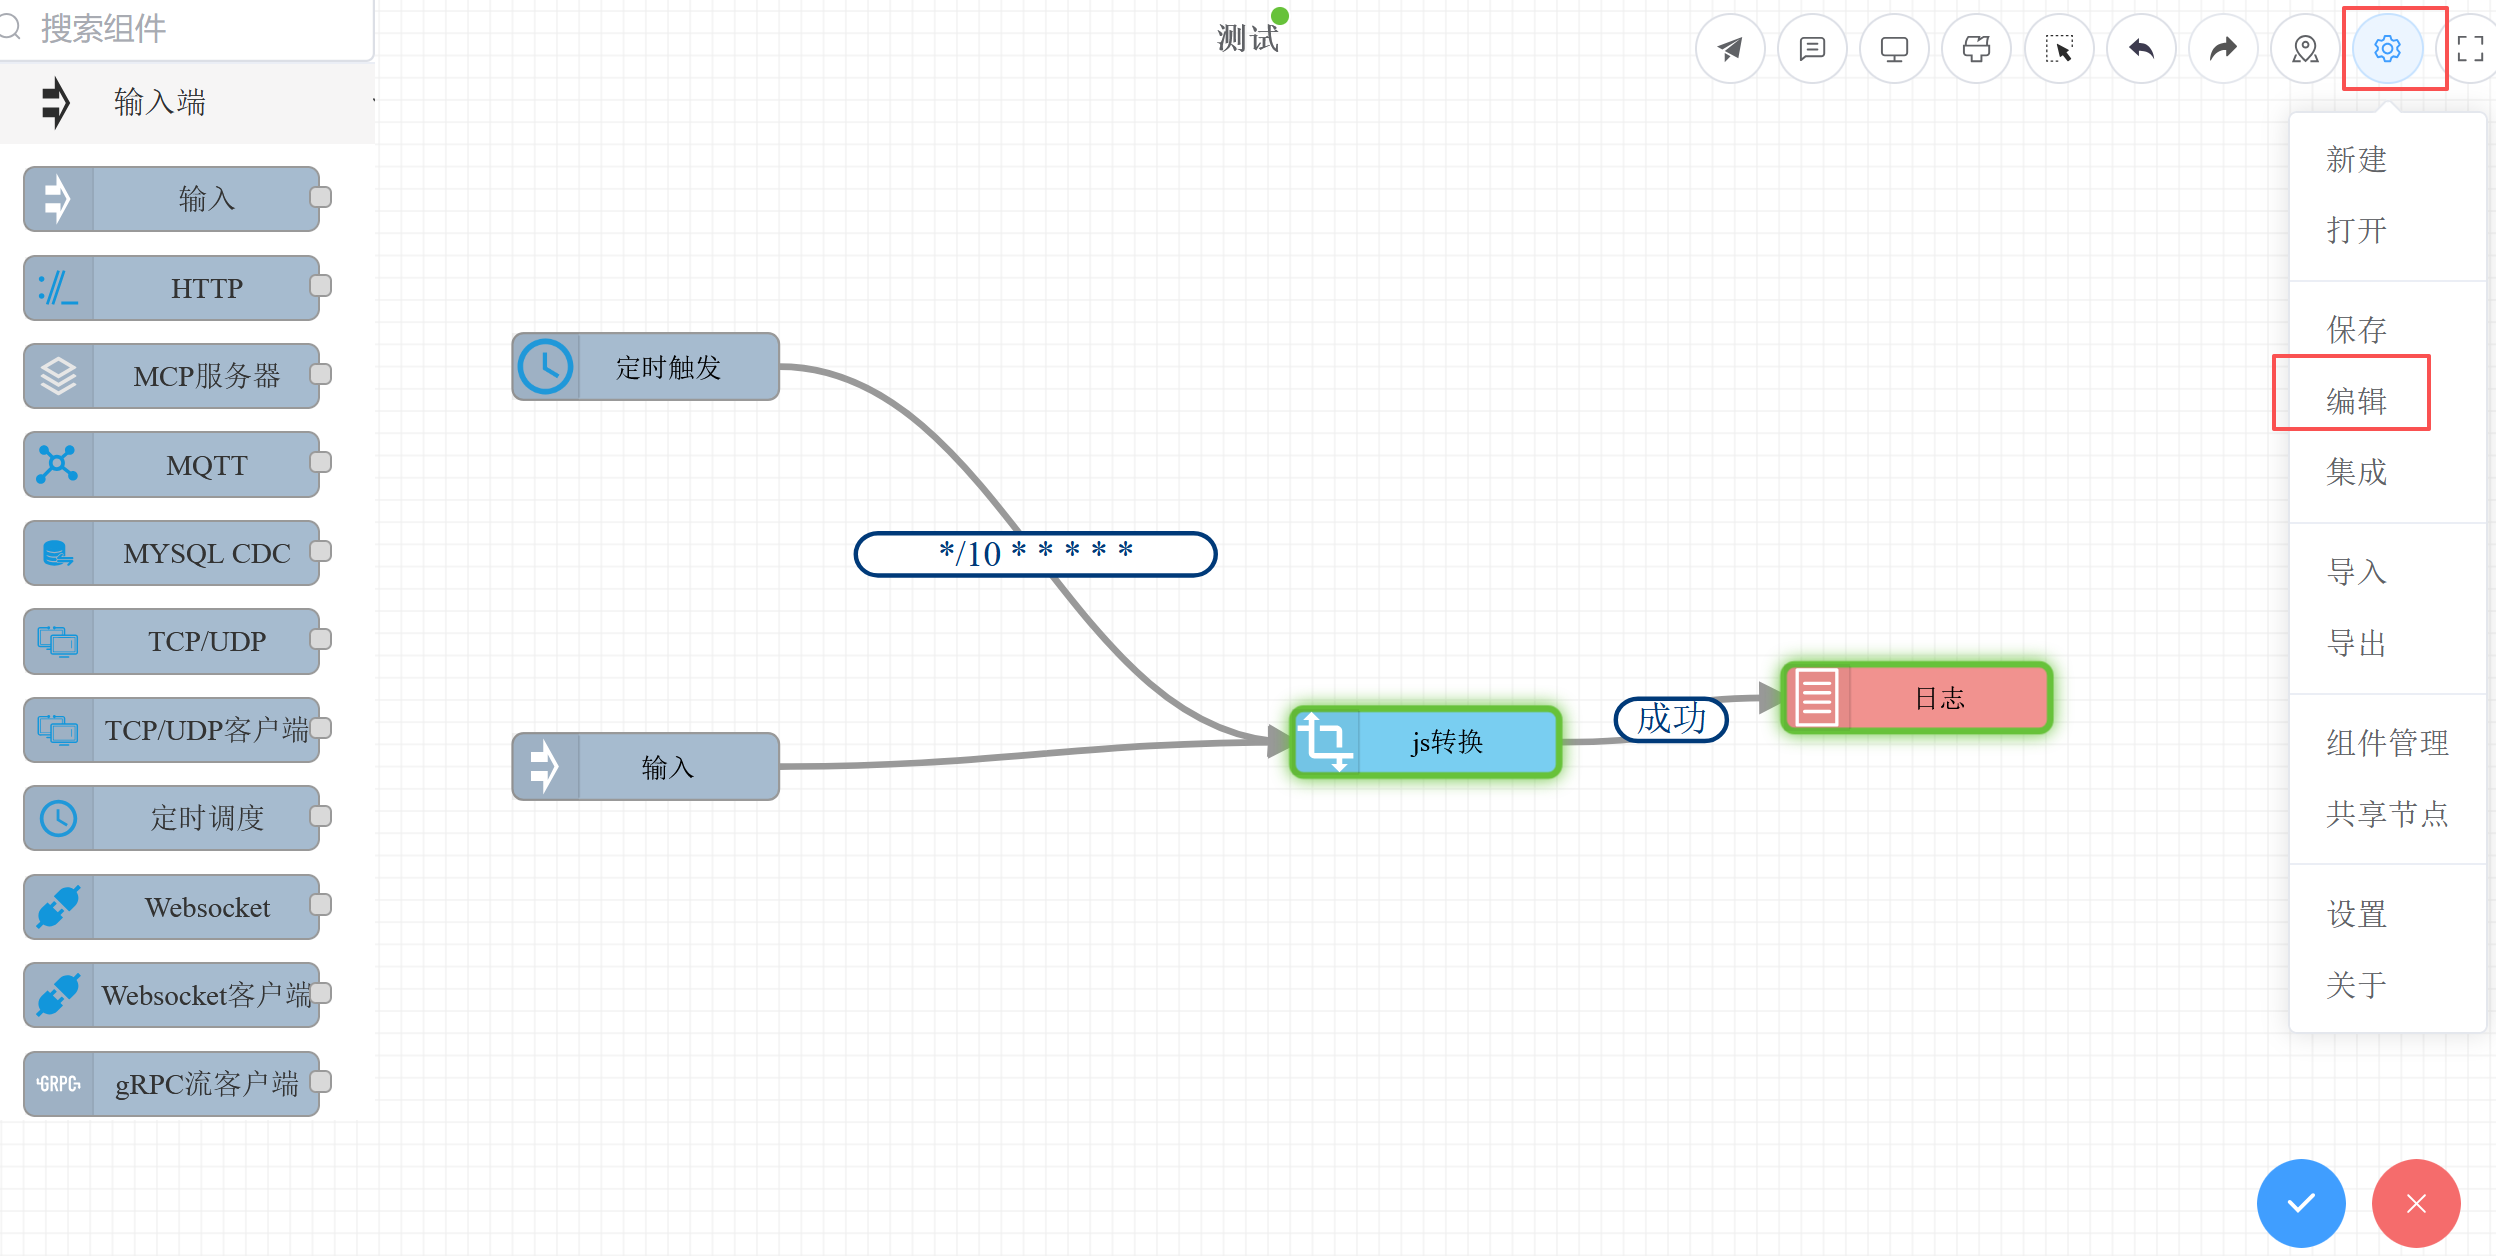
# Enabling Debug Mode
Click Settings -> Edit on the toolbar to open the rule chain debug mode switch:
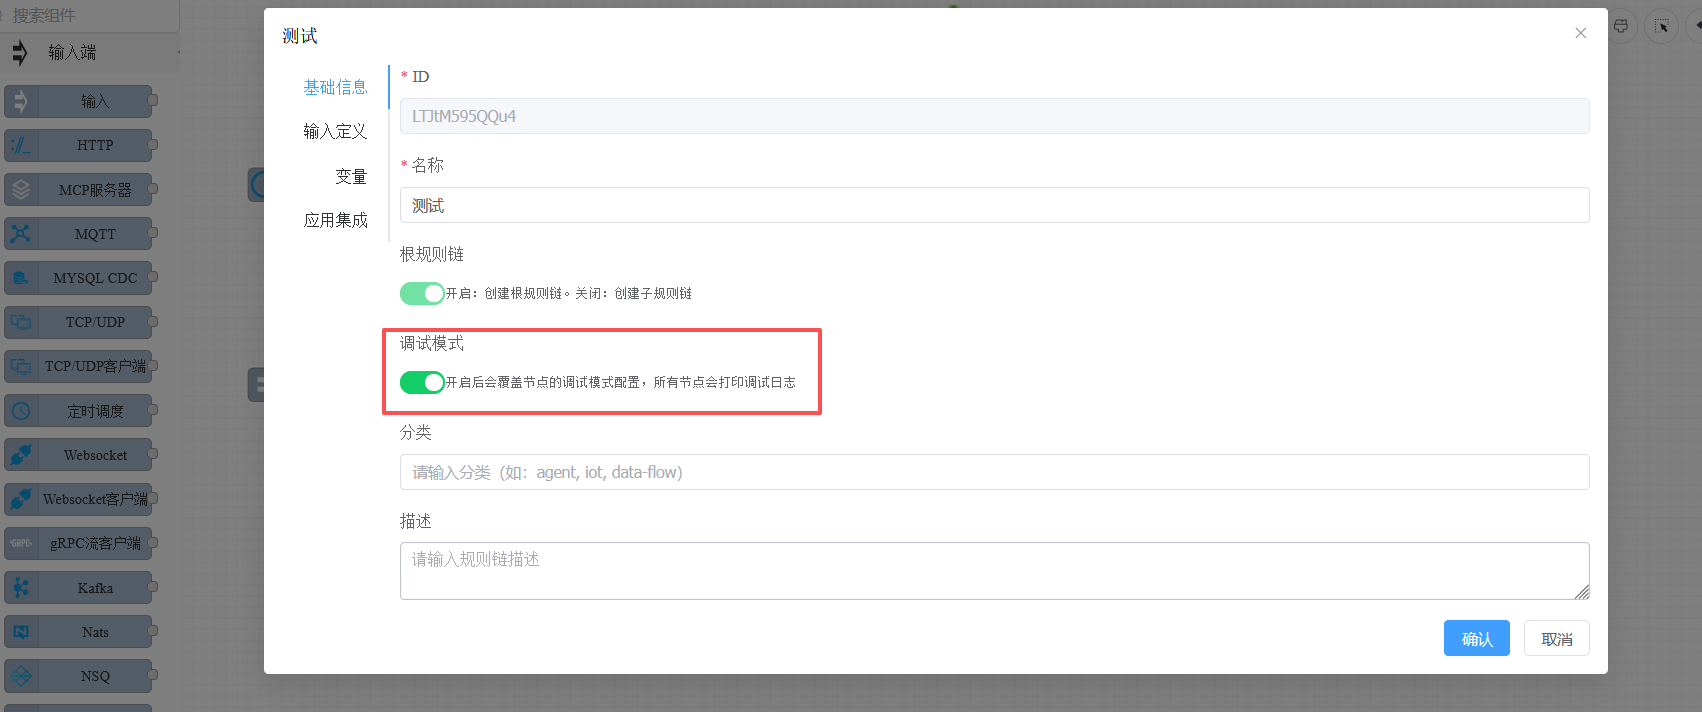
Note: When testing via the Run Rule Chain dialog, it automatically runs in debug mode, so you don't need to manually enable this switch.
# Run Tests
Click the Run button on the toolbar, enter test data, and execute:
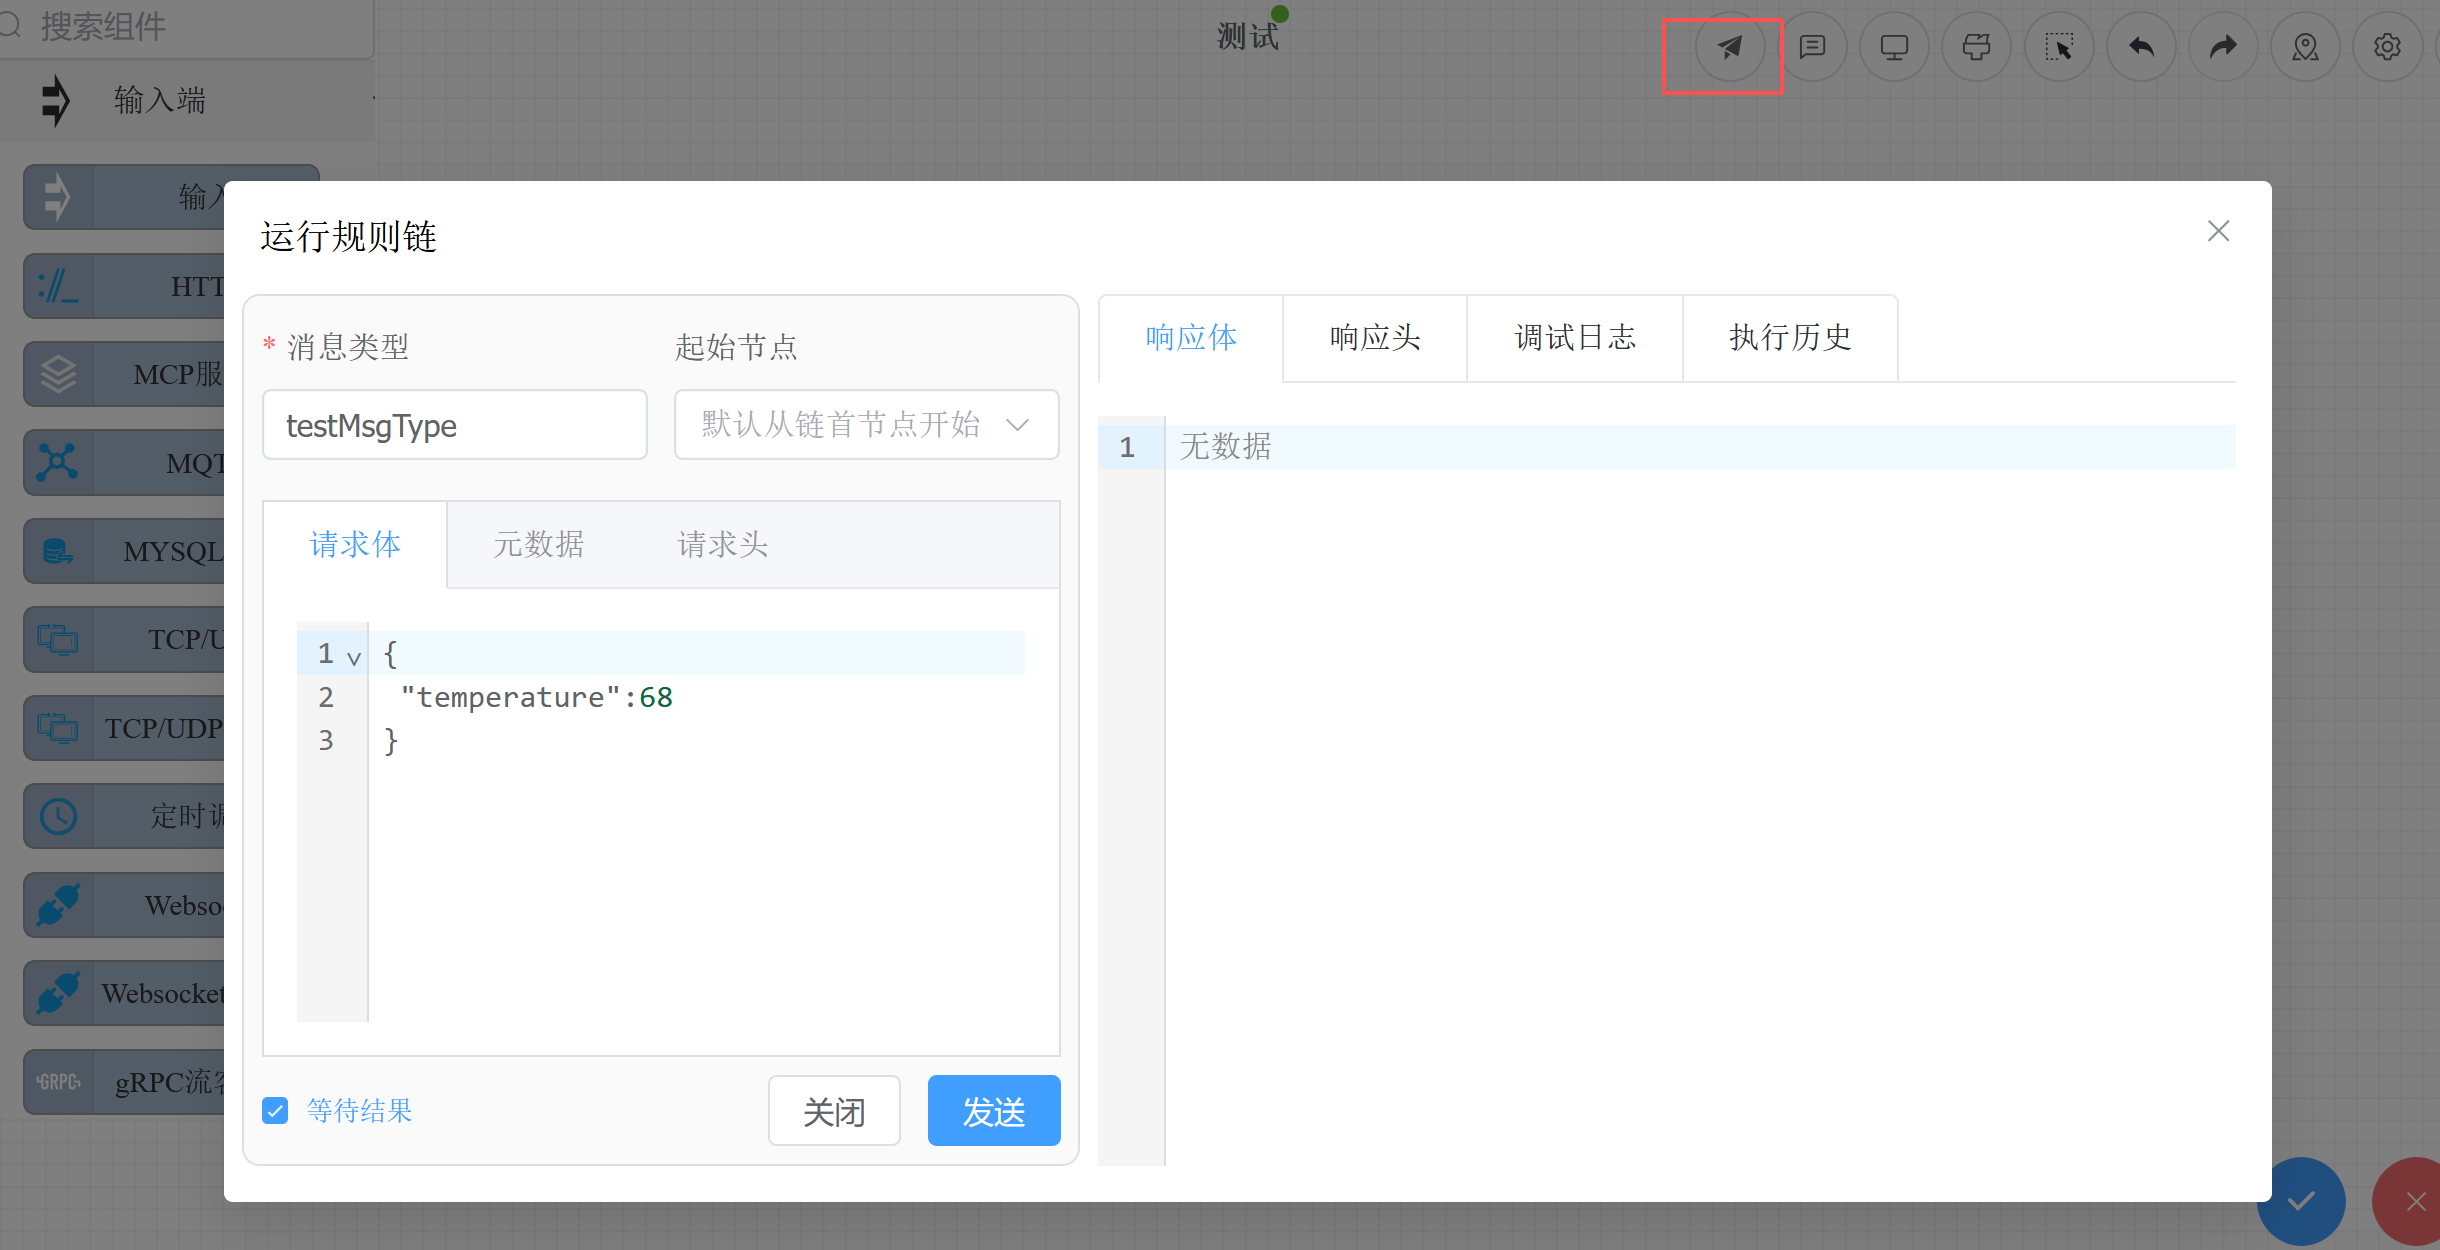
Two execution modes are supported:
| Mode | Description |
|---|---|
| Synchronous execution (execute) | Wait for the rule chain to finish executing, then return the final result |
| Asynchronous execution (notify) | Return immediately after sending, suitable for long-running rule chains |
# Viewing the Debug Console
The bottom debug console displays IN/OUT data for each node in real time via WebSocket:
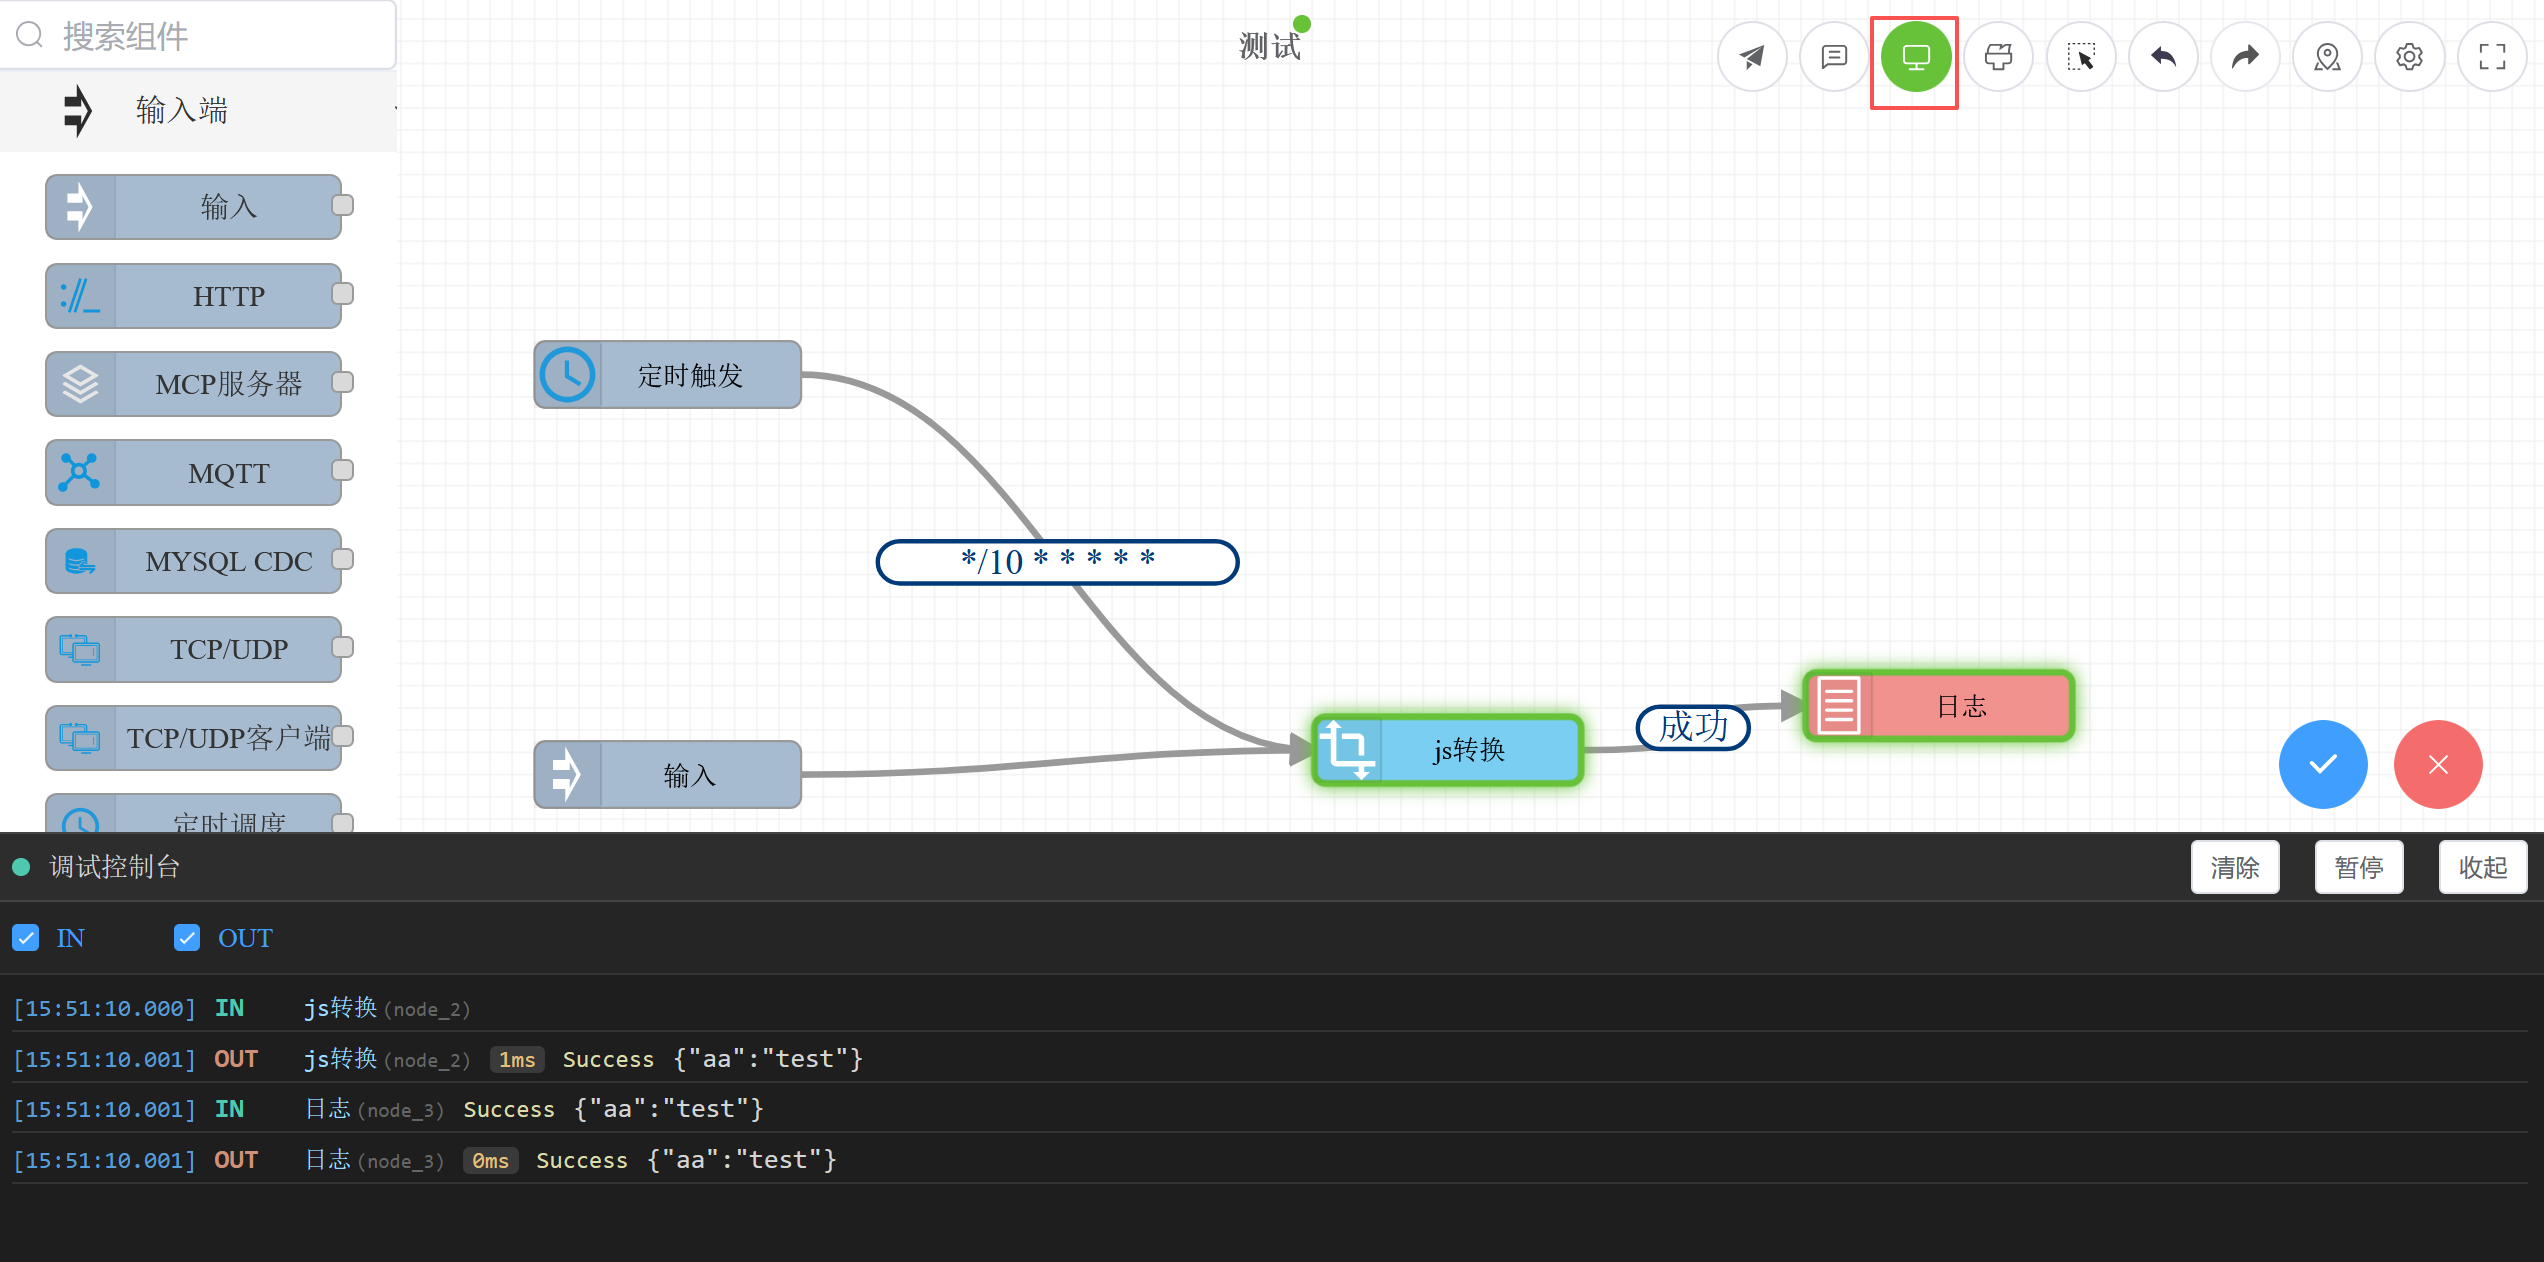
Console information includes:
| Field | Description |
|---|---|
| Timestamp | Precise time when the event occurred |
| Type | IN (node received data) / OUT (node processing complete) |
| Node | Node name and ID; click to jump to node details |
| Duration | Node processing time (shown for OUT events, automatically calculated as OUT.ts - IN.ts) |
| Relation Type | Data flow relation (Success, True, False, etc.) |
| Data | Message content |
Supported operations:
- Filter: Check IN/OUT to filter display
- Pause: Pause auto-scrolling to easily view historical data
- Clear: Clear debug data
- Click node name: Jump to that node's debug detail panel
# Single-Node Debugging
Right-click on a node to start execution from that node, or execute only that node:
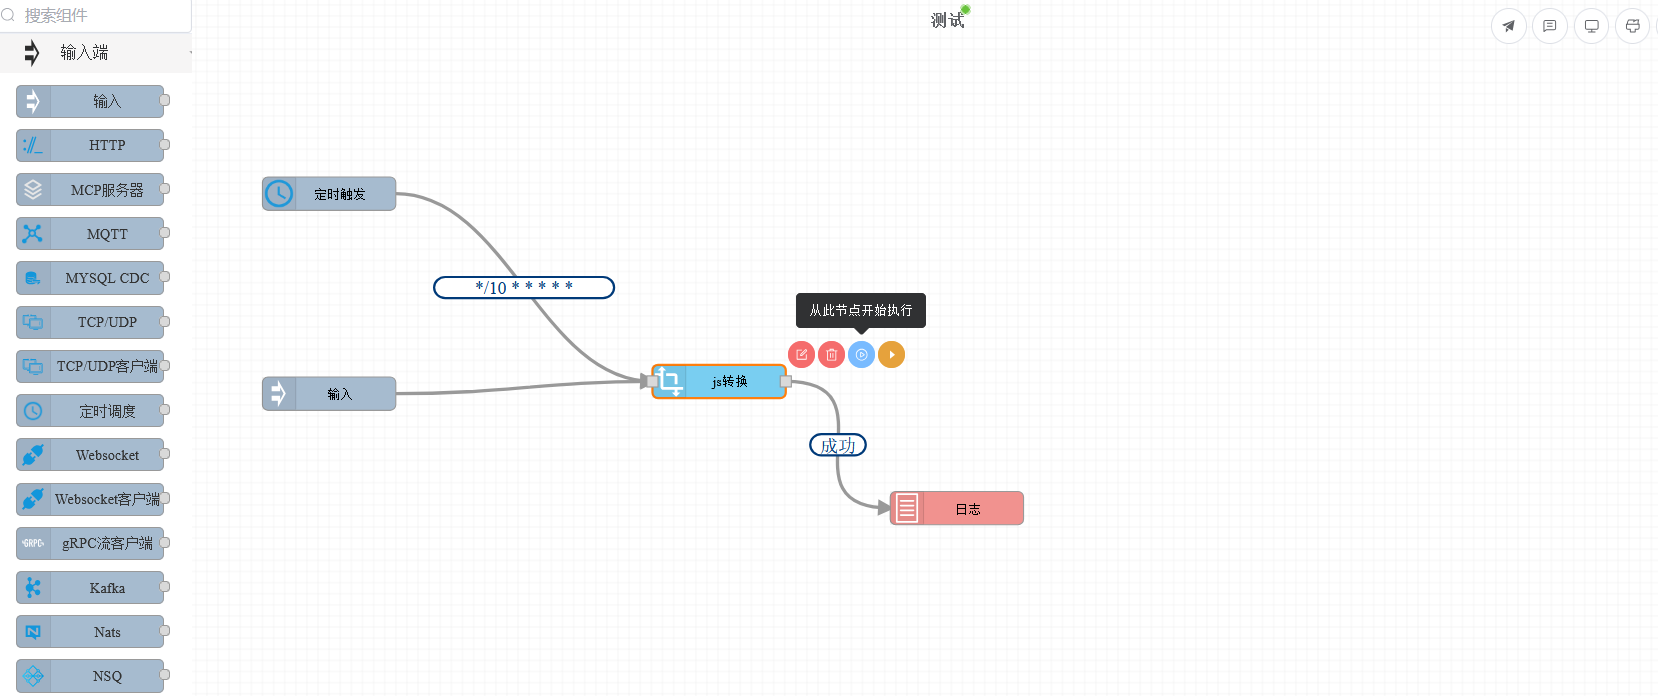
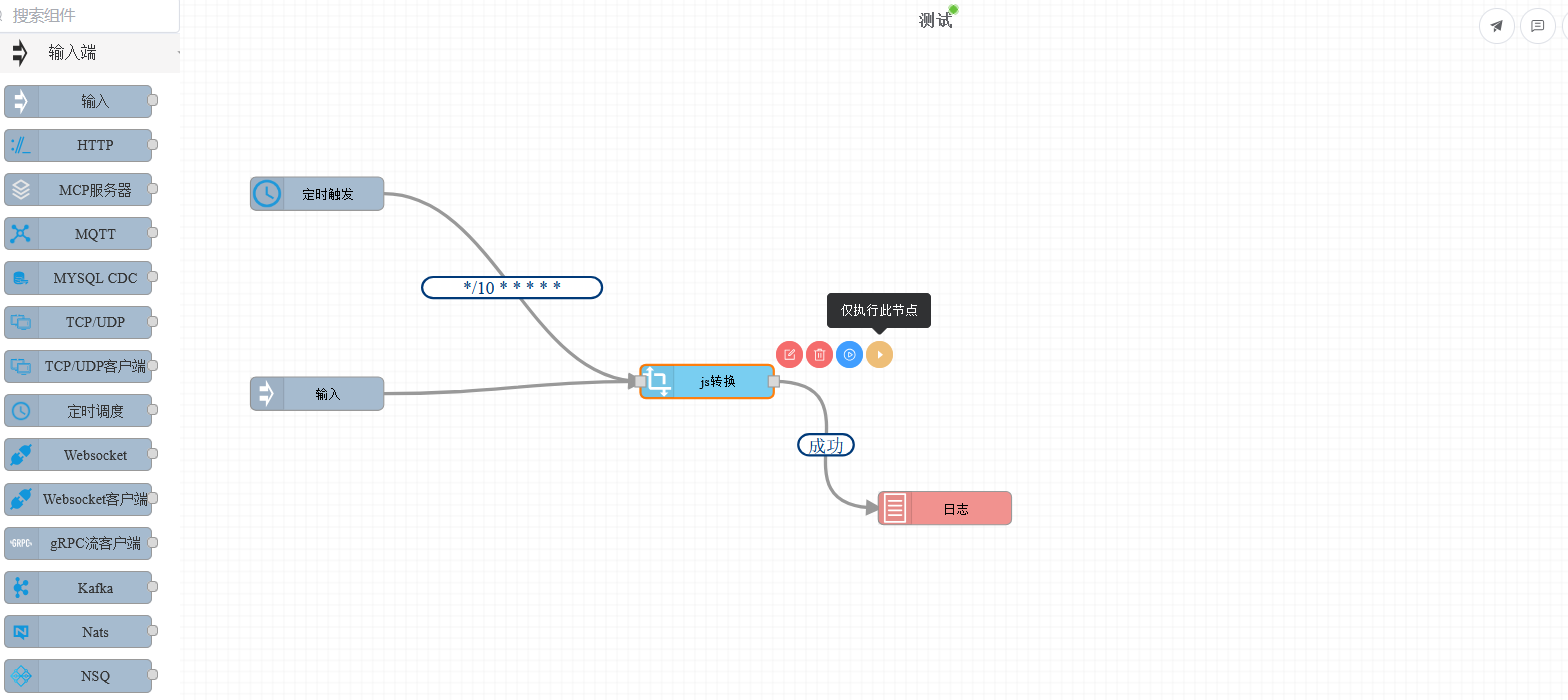
These two methods are very useful when debugging complex rule chains:
- Start execution from this node: Skip preceding nodes and start executing subsequent flow from the selected node
- Execute only this node: Execute only the selected node to verify the processing logic of a single node
# Node Debug Logs
Double-click a node to view its historical debug logs, including input parameters, output parameters, and error information:
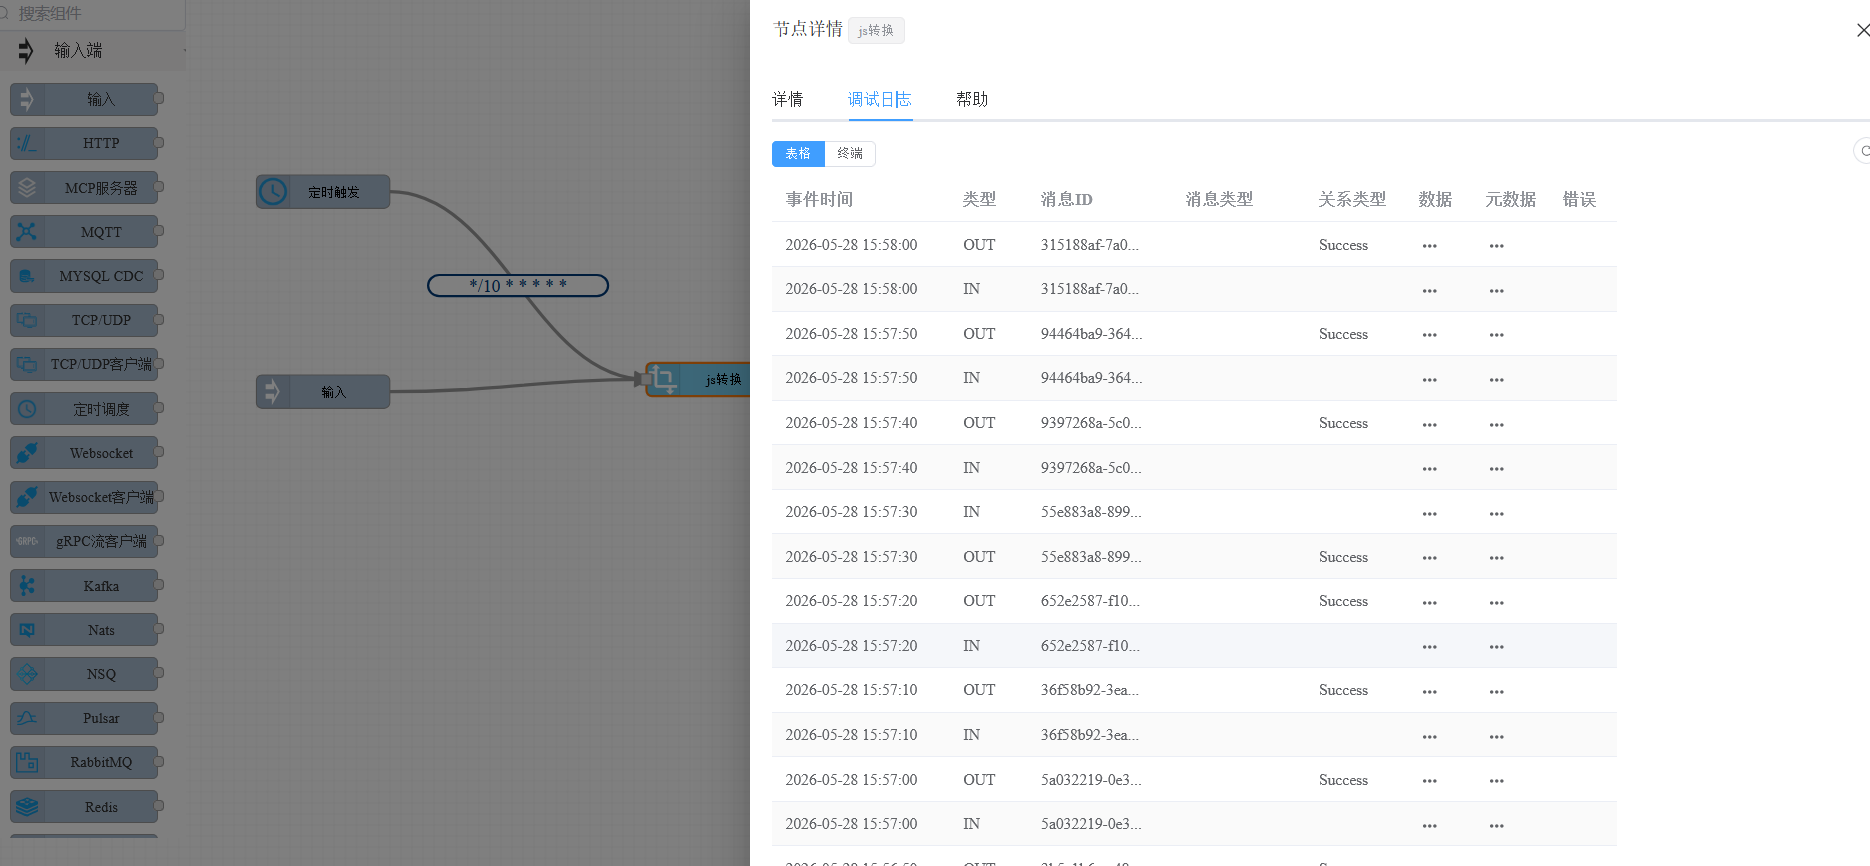
Logs support both table and terminal view modes. You can view:
- Input message: Data received by the node (msg, metadata, msgType)
- Output message: Data returned after node processing
- Error information: Error details when node execution fails
- Execution duration: Processing time for each record
# Execution History
Switch to the Execution History tab in the run dialog to view historical execution records for this rule chain:
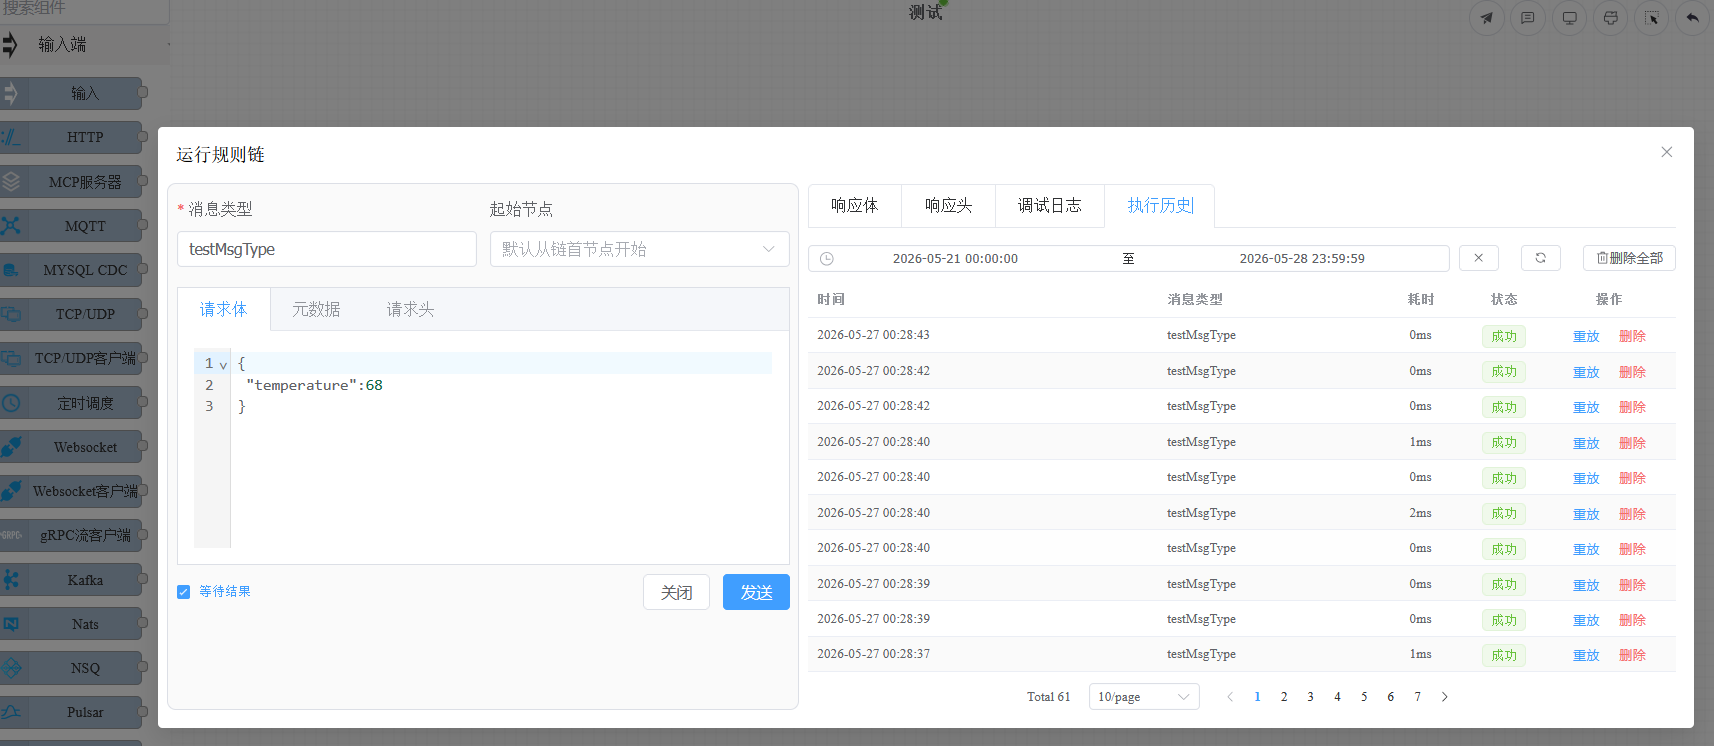
Each record displays: execution time, message type, total duration, and success/failure status. Click on a record to view the detailed execution steps for each node, and support replay operations (re-execute with the same input data).
Execution history requires the
save_run_log = trueconfiguration to be enabled on the backend. For details, see Run Logs.